

How Data Insights Drive Product Innovation and Improve Decision-Making
Introduction
In today’s competitive market, data has become one of the most valuable assets for product managers. The ability to harness data effectively can mean the difference between a product that thrives and one that fails to meet market expectations. Data-driven decision-making allows product teams to move beyond intuition and gut feelings, using concrete insights to shape product strategy, improve user experience, and drive business growth.
The rise of successful companies like Amazon, Netflix, and Spotify illustrates the power of data in driving product innovation. Amazon’s recommendation engine, Netflix’s content curation, and Spotify’s music discovery algorithms are all examples of how data can transform user engagement and product performance. Data insights help product managers understand customer behavior, identify market trends, test new features, and measure the success of product iterations.
This article explores how to leverage data for smarter product decisions. We’ll cover the types of data that matter, how to implement a data-driven framework, and real-world case studies that demonstrate how companies are using data to drive product success.
Why Data Matters in Product Decisions
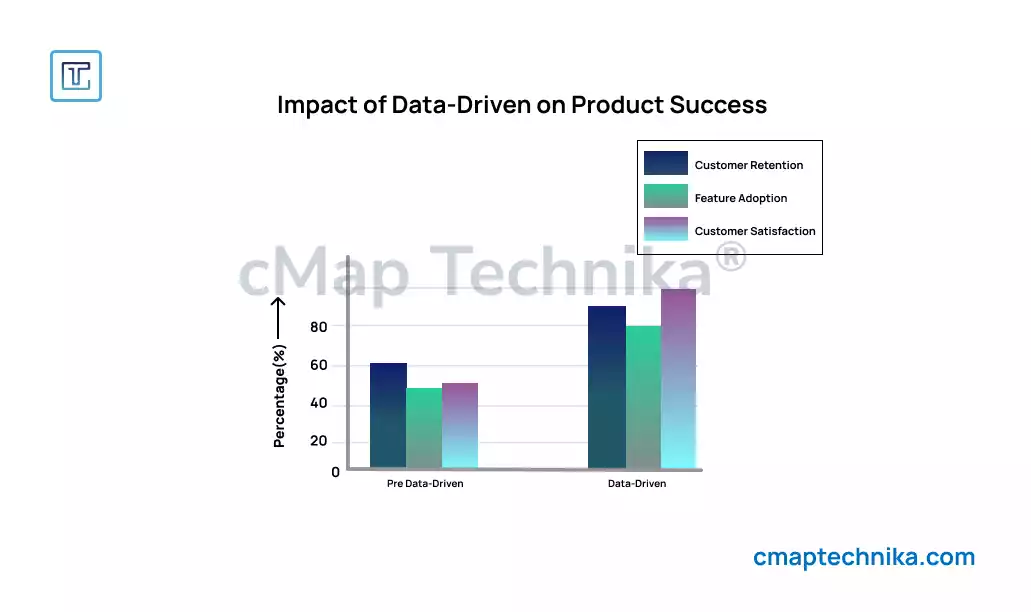
Data provides product teams with the ability to make informed decisions rather than relying on assumptions or guesswork. Understanding customer behavior, market trends, and operational performance gives product managers the insight needed to refine product strategies, eliminate inefficiencies, and uncover new growth opportunities.
1. Enhanced Customer Understanding
Data allows product teams to map the customer journey, identify pain points, and optimize user experience. For example, user behavior data can reveal where customers are dropping off in the onboarding process or where they struggle with product features.
- Example:
Airbnb uses customer journey data to analyze booking patterns and improve user experience. When Airbnb discovered that many users abandoned bookings at the payment stage, they investigated the cause through user session recordings and feedback. They found that unclear pricing and hidden fees were major pain points. Airbnb addressed this by introducing transparent pricing breakdowns and upfront total costs before checkout. This small but data-informed change increased booking completions by over 15%.
2. Improved Feature Prioritization
Understanding which product features are driving the most engagement and satisfaction helps product teams prioritize development efforts. Data-driven feature prioritization ensures that resources are allocated effectively toward the highest-impact changes.
- Example:
LinkedIn used data to refine its content algorithm. The product team analyzed user interaction data and discovered that posts with images received 30% more engagement than text-based posts. However, they also found that too many image-based posts lowered content quality. By balancing content recommendations based on user interaction patterns and quality scores, LinkedIn optimized engagement without compromising user experience.
3. Faster Problem Resolution
Real-time data monitoring allows teams to identify and address performance issues and customer complaints quickly. Analytics platforms can flag unusual user behavior, performance bottlenecks, or technical glitches.
Example:
Slack monitors real-time user activity to detect platform issues. When a spike in login failures was detected, the product team traced the problem to an overloaded authentication server. By identifying the issue through real-time monitoring, Slack reallocated server capacity and implemented a load-balancing solution—reducing login errors by 40% within hours.
Types of Data for Smarter Product Decisions
To leverage data effectively, product managers must understand the different types of data available and how they can be used to inform product decisions.
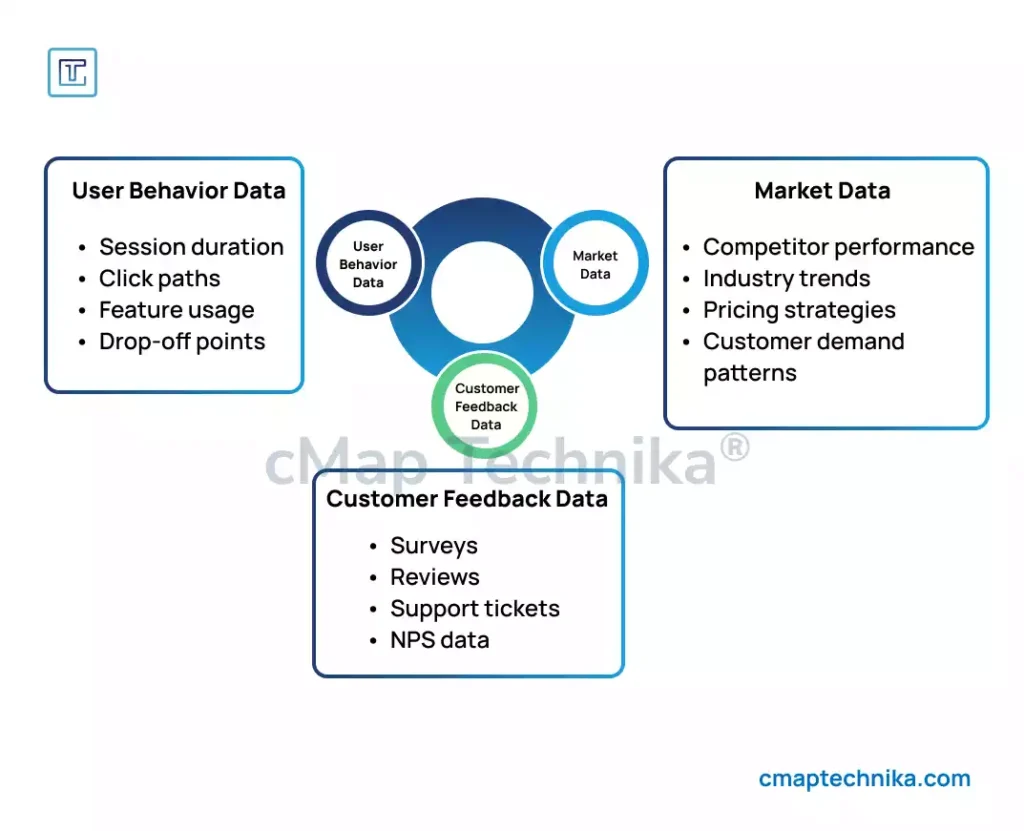
1. User Behavior Data
User behavior data includes metrics such as session duration, click paths, drop-off points, and feature usage frequency. This data helps teams understand how users interact with the product.
- Example:
Spotify tracks user listening habits to curate personalized playlists. They analyze song skips, repeats, and likes to understand user preferences. This behavior data powers the “Discover Weekly” playlist, which drives significant user engagement and retention.
2. Market Data
Market data includes competitor performance, industry trends, and customer demand patterns. Understanding market conditions helps product managers align product strategy with external opportunities and threats.
Example:
Tesla uses market data to adjust production and pricing strategies. When demand for electric vehicles surged in 2021 due to increased fuel prices and government incentives, Tesla adjusted its production capacity and launched lower-priced models to capture market share.
3. Customer Feedback Data
Direct customer feedback—through surveys, reviews, and support tickets—provides qualitative insights into user satisfaction and pain points.
Example:
Amazon’s product review system generates a wealth of customer feedback data. Amazon uses natural language processing (NLP) to analyze reviews and identify recurring complaints or feature requests. This feedback directly influences product improvements and vendor adjustments.
Implementing a Data-Driven Framework
To leverage data effectively, product teams need a structured approach to collecting, analyzing, and applying insights.
1. Establish Clear Metrics and KPIs

Defining success metrics is essential for measuring progress, evaluating product performance, and identifying areas for improvement. Well-defined KPIs provide a structured way to assess whether a product strategy is working and where adjustments may be needed. Here are key product KPIs that drive smarter decision-making:
Customer Churn Rate – Measures the percentage of customers who stop using a product over a given period. A high churn rate may indicate usability issues, lack of product-market fit, or better alternatives available in the market.
Example: Netflix closely monitors churn rates by tracking subscription cancellations. After identifying that content fatigue was driving higher churn, they increased investment in original content, leading to a more engaged user base and lower churn.
Customer Lifetime Value (CLV) – Represents the total revenue a company expects to generate from a customer over the entire period of their relationship. Increasing CLV requires improving customer experience and fostering long-term engagement.
Example: Amazon enhances CLV by recommending personalized products based on past purchases and browsing behavior, increasing repeat purchases and overall customer value.
Repeat Purchase Rate – Tracks how often customers return to purchase the product or service. A high repeat purchase rate indicates strong customer loyalty and satisfaction.
Example: Starbucks leverages its loyalty program to increase repeat purchases by offering personalized rewards based on customer behavior and preferences.
Net Promoter Score (NPS) – Measures customer willingness to recommend a product to others on a scale from -100 to +100. High NPS reflects strong customer advocacy and satisfaction.
Example: Tesla uses NPS to measure customer enthusiasm for new product releases. Positive NPS scores correlate with increased word-of-mouth referrals and stronger brand equity.
Customer Engagement Metrics – Includes user activity, feature usage, and time spent on the platform. High engagement rates typically reflect strong product-market fit and value delivery.
Example: Instagram tracks engagement metrics like daily active users (DAU) and story completion rates. High engagement on stories led to increased ad revenue and product stickiness.
Customer Satisfaction (CSAT) Score – Measures user satisfaction based on direct feedback, typically gathered through surveys and post-interaction reviews.
Example: Apple tracks CSAT scores at its Genius Bar locations. Low scores prompt deeper investigation into product issues or customer service quality, leading to targeted improvements.
2. Build a Centralized Data Platform
Centralized data platforms ensure that all product teams have access to the same information. Platforms like Google BigQuery, Snowflake, and AWS Redshift enable data aggregation and analysis across product, engineering, and marketing teams.
- Example:
Uber built a centralized data platform to track ride requests, driver availability, and surge pricing in real-time. This platform enables product teams to make dynamic adjustments to pricing and driver allocation based on real-time demand and supply conditions.
3. Foster a Culture of Data-Driven Decision-Making
Encouraging all team members to use data in their decision-making ensures that data insights are integrated into daily operations. Product managers should provide training on data tools and platforms and incentivize data-backed proposals.
Example:
Netflix’s “Test and Learn” culture encourages experimentation. Product teams are required to present data to support new feature proposals. When Netflix considered adding a “Skip Intro” button, A/B testing data showed that over 70% of users skipped intros manually. The data-backed decision to introduce the feature increased user engagement and content completion rates.
Case Studies
1. Amazon’s Recommendation Engine
Amazon’s recommendation engine generates 35% of the company’s total revenue. It uses collaborative filtering, content-based filtering, and deep learning to analyze customer purchase patterns and browsing behavior. By combining data from similar user profiles and past purchases, Amazon generates personalized recommendations that drive higher conversion rates and customer satisfaction.
2. Netflix’s Content Strategy
Netflix leverages viewership data to make content acquisition and production decisions. Data on viewing habits, pause points, and completion rates are used to identify successful content patterns. This led to investments in original content like House of Cards, which was greenlit based on audience data showing a preference for political dramas.
3. Google’s Search Algorithm Optimization
Google’s search algorithm constantly adapts based on user behavior data. Search click-through rates, bounce rates, and user dwell time provide signals for ranking adjustments. This ensures that search results remain relevant and valuable to users, driving Google’s dominance in the search market.
Conclusion
Leveraging data for smarter product decisions is no longer optional—it’s essential for competitive advantage. Companies like Amazon, Netflix, and Google demonstrate how data insights can shape product strategy, improve user experience, and drive business success. By building a data-driven culture, defining clear KPIs, and using centralized platforms to aggregate insights, product managers can make informed decisions that deliver tangible business outcomes. Data-driven product management enables faster innovation, greater customer satisfaction, and sustainable long-term growth.

Author: Abhi Misra
Brings 10+ years of experience in Cloud, AI, and Cyber led large digital transformation initiatives ▪️ Has worked for multiple Fortune 50 Big Tech clients like Microsoft, Symantec (now Broadcom), JP Morgan Chase, and Lockheed Martin. His most recent role was with the Big 4 consulting firm Deloitte Consulting, USA ▪️ Holds an MS in Data Analytics Engineering from George Mason University, USA & MTech in Biomedical Engineering from IIT Bombay, India